

Services
We build maps that vary in size, complexity and resolution. Ultimately, the map details are dependent on the data and imagery that is available for the area. We work remotely from the United States in Poplarville, Mississippi but can deliver our services globally! We’ve teamed up with some of the world’s leading designers and are very proud to be of service to them!
Detailed Basemaps
Having an accurate digital representation of the landscape, is extremely useful when planning. This information is CRITICAL for routing access throughout a property and controlling how water flows over the terrain. We can steer water away from erosion potentials, contamination, and wasted opportunity. We can pacify the volume and velocity of the water flow through various types of earthworks, thereby passively hydrating the landscape and recharging our rapidly depleting aquifers.
All objects contained on-site are digitally rendered and layered over a variety of base maps. Pricing depends on size and complexity of the property.
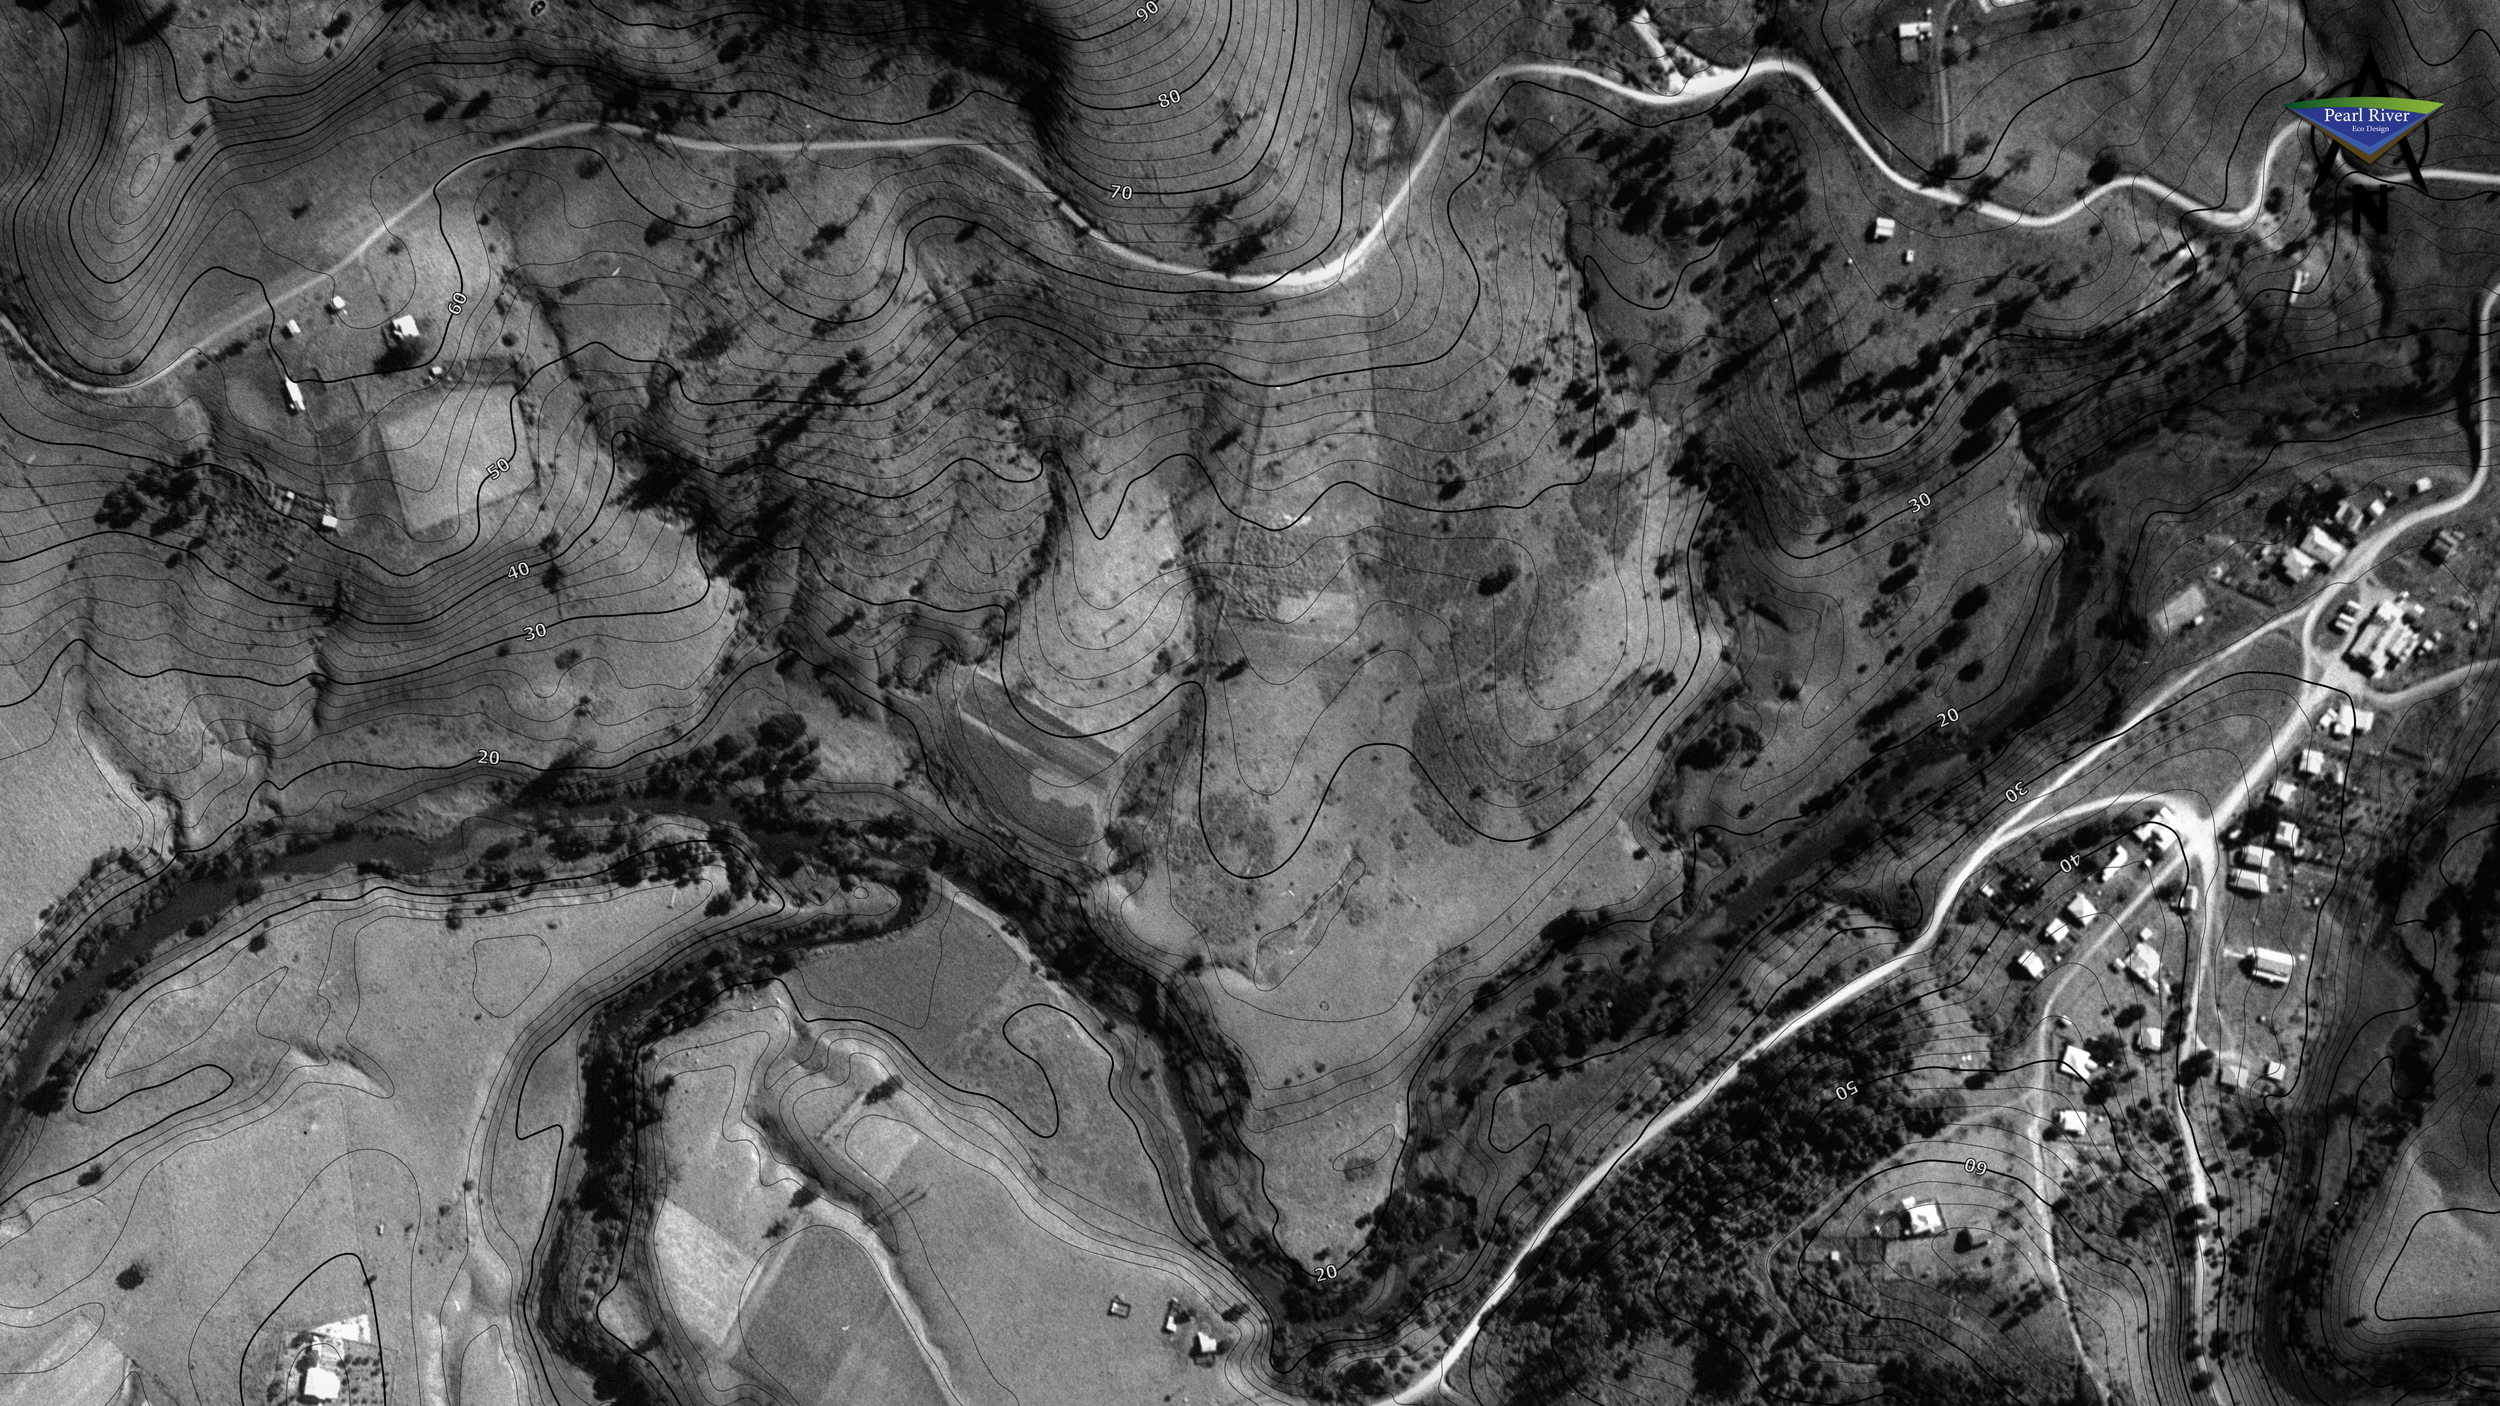
LiDAR Map Series


Faded Map
Offers a simplified, low-contrast version of a satellite image, making it ideal for sketching and low ink consumption when printing. It’s subdued color palette allows for clear, focused design sketches, annotations, and overlays without competing with the original site details.
In permaculture design, these maps can be particularly useful during brainstorming and conceptual stages. The faded topography and features offer a visual guide, but don't overwhelm or dictate the design, providing the designer a freedom to explore, iterate, and refine design elements.
Moreover, when it comes to presenting or discussing ideas with clients, colleagues, or stakeholders. Faded Maps offer an easy-to-read background that highlights the design work rather than the underlying map. This allows for a clearer communication of ideas, fostering understanding and collaboration in the design process.


Altitude
Maps provide key information about the elevation of the land at different points across the landscape. These maps offer insights into the terrain as well as the microclimatic conditions related to elevation.
Altitude significantly affects temperature, with higher elevations usually being cooler than lower areas. It also influences patterns of fog, frost and wind, which and can affect species distribution due to these microclimate variations.
An Altitude Map helps to make informed decisions, like planting late-budding species in the higher areas to avoid frost damage. Warmer, lower altitude areas could be used for crops needing more heat.
By enabling us to work with the unique characteristics of the site, Altitude Maps guide us in creating resilient, productive systems that respect the landscape's innate conditions.


Slope
Maps are essential in permaculture design for assessing the land's gradient. These maps differentiate degrees of slope, with each gradient represented by a unique color. This clear visual aids in pinpointing areas suitable for development, zones with potential machinery hazards, and steeper sections prone to erosion that should be left undisturbed.
Flat to gently sloping areas (<=4°) are often ideal for main crops and infrastructure due to their ease of access and movement. Moderately steep areas (<=12°) typically lend themselves well to terraced food forests, harnessing the natural gradient for efficient water distribution and controlling potential erosion. Steepest areas (>=18°) present unique challenges. Prone to erosion and machinery tipping hazards, they are typically designated as prime Zone 5, or 'wild' areas. Left largely untouched, these regions serve as wildlife habitats and natural buffer zones, with some access points for occasional management.
When planning access routes throughout the property, slope maps prove invaluable. By routing roads through less steep areas, construction and maintenance costs are reduced, and environmental impact is minimized.
Overall, Slope Maps guide informed and respectful design decisions, promoting designs that are functional, sustainable, and in harmony with the terrain's natural features.


Wet / Dry
This map is a custom map that helps identify areas of the site that are naturally water-logged or dry, usually determined by landscape features like low points, valleys, slopes, and ridge lines.
The Wet / Dry Map assists in making informed decisions regarding water management, plant species selection, and infrastructure placement. Lower-lying areas that accumulate water during the rainy season could be utilized to design ponds and wetland gardens, to plant water-loving species, and to create habitats for aquatic wildlife. This approach enhances the landscape's natural tendency rather than trying to alter it. Conversely, high and dry areas, such as ridge lines, are beneficial for constructing structures and pathways due to their good drainage characteristics.
By helping designers work in harmony with, rather than against, the inherent patterns of the landscape, the Wet / Dry Map embodies the permaculture philosophy of observing and following nature's lead in design.


Solar Aspect Maps
Show the compass direction each part of the landscape faces. The aspect influences microclimatic conditions like sunlight exposure, temperature, and wind patterns, which affects the suitability of different areas for specific plants and land uses.
For instance, a south-facing area, which receives abundant sunlight, is ideal for sun-loving crops, solar panels for energy generation, and the main living areas of homes to maximize passive solar gain. On the other hand, cooler, north-facing areas, which are more shaded, can be used to grow shade-tolerant plants or place structures that don't require as much solar gain.
By enabling a clear understanding of the solar and thermal dynamics of a site, Aspect Maps allow for optimal placement of design elements, making the overall design more energy-efficient and productive.


Terrain Ruggedness
Speaks to the landscape's overall complexity. Although it seems similar to the slope map, the Terrain Ruggedness Index classifies the landscape into categories from 'level' to 'extremely rugged'. You get to see the slope complexity throughout. This is a linear understanding of slope… from A - Z. You can see where are the flattest or steepest slopes are and everything in between!
Historical Images
Some locations have historical images available. For an additional charge, they can be incorporated into your map series. Historical images are crucial in permaculture design as they reveal past land uses and modifications, aiding in the restoration and sustainable management of ecosystems. By examining these images, designers can identify natural and human-induced patterns, learn from previous land management successes or failures, and set baselines for restoration projects.


Soil Maps
Some governments have soil maps available. They provide crucial insights into the types, composition, and distribution of soils across a site, playing a vital role in permaculture design. The varying characteristics of soil, such as texture, structure, depth, pH, organic matter content, and nutrient levels, directly influence the soil's water-holding capacity, fertility, erodibility, and its compatibility with different plant species and land uses.
Dermosols are soils with structured subsoils and without a strong increase in clay content between topsoils and subsoils. These soils are found in imperfectly drained sites (Yellow and Grey Dermosols) with rainfall between 550–1350 mm and in well-drained sites with rainfall between 450–1200 mm. Dermosols generally have high agricultural potential with good structure, and moderate to high chemical fertility and water-holding capacity with few issues relating to their use or management.
Kurosols are soils with a strong increase in clay content between topsoil and subsoil, and with strongly acidic subsoils. This inherent acidity can also result in other chemical issues, such as high magnesium, sodium and aluminium concentrations, that can inhibit plant growth. Kurosols generally have very low agricultural potential with high acidity (pH less than 5.5) and low chemical fertility. Kurosols commonly have low water-holding capacity and are often sodic.
Digital Art
After gathering all of the available data and generating the above mentioned layers, I visually identify and digitize every object found on site: roads, paths, trees, buildings, water bodies, etc. This is important when swapping out satellite or drone imagery for other base maps.

Larger Areas
My Maps are HUGE and in high resolution. You can print these maps as small or extremely large wall-sized murals. They are very handy to print and laminate to use during the design and installation process.
City planners, emergency services, national parks or perhaps an art piece for your study.

The Wider View
It’s useful to be able to see the terrain around you and know the neighboring lands. Especially, what gravity brings you downhill. Where you fall in the watershed allows you to see where your water is coming from and going to (the sink and source). Below is a 300 acre watershed that feeds a series of large ponds
Animated Videos
I can generate 2D and 3D animations from the digital art I make.
Whole Watershed and City Areas
Partner with those who share a watershed area to restore our precious waters and wildlife populations. Plan riparian buffers and nature corridors, for example. These maps help guide a designer to work towards unlocking the land’s true holding capacity for both humans and wildlife.
